 The best method for identifying seizures and their biologic surrogate, which is eleptiformorm discharges.
Measures electrical activity of the brain by mapping the firing of neurons involved in brain wave activity.
Brain waves are indicative of the low voltage electrical activity transmitted through the neurons.
Is a complement to the neurologic examination.
Refers to the recording of electrical activity along the scalp measuring voltage fluctuations resulting from ionic current flows within the neurons of the brain.
Refers to the recording of the brain’s spontaneous electrical activity over a short period of time, usually 20–40 minutes, as recorded from multiple electrodes placed on the scalp.
Four basic brain – wave patterns, they’re different and frequency and amplitude may be evaluated: beta,alpha, Delta and theta.
Diagnostic studies focus on the neural oscillations that can be observed in EEG signals.
The main diagnostic application is in the case of epilepsy, as epileptic activity can create clear abnormalities on a standard EEG study.
Other clinical uses of EEG is in the diagnosis of coma, encephalopathies, brain death, and for studies of sleep and sleep disorders.
Used to be a first-line method for the diagnosis of tumors, stroke and other focal brain disorders.
Variation in EEG techniques include evoked potentials (EP), which involves averaging the EEG activity associated with the presentation of a stimulus of a visual, somatosensory, or auditory type.
Event-related potentials refer to EEG responses that are time-locked to complex processing of stimuli used in cognitive science and psychophysiological research.
Neurons are electrically charged by membrane transport proteins that pump ions across their membranes, exchanging them with the extracellular milieu.
In the process of volume conduction ions reaches the electrodes on the scalp and can push or pull electrons on the metal on the electrodes, and the difference in push or pull voltages between any two electrodes can be measured by a voltmeter, resulting in the EEG.
EEG activity reflects the summation of the synchronous activity of millions of neurons that have similar spatial orientation.
Cortical pyramidal neurons produce the most EEG signal because they are well-aligned and fire together.
Voltage field activity from deep in the brain is more difficult to detect than currents near the skull.
Scalp EEG activity shows oscillations at a variety of frequencies. and are associated with different states of brain functioning and represent synchronized activity over a network of neurons.
A routine clinical EEG recording usually involves recording from scalp electrodes.
Routine EEG is typically used to distinguish epileptic seizures from other types of spells, to differentiate encephalopathy or delirium from primary psychiatric syndromes, to establish brain death, to prognosticate in patients with coma, and to determine whether to wean anti-epileptic medications.
At times routine EEG is inadequate, and it is necessary to record a patient during a seizure.
Continual monitoring may be necessary to provide information about whether or not a spell is an epileptic seizure and to identify the site of the brain from which the seizure activity may emanate.
EEG monitoring is typically done: to distinguish epileptic seizures from other types of spells including:syncope, movement disorders and migraine variants, to characterize seizures, to localize the region of brain from which a seizure originates.
EEG may be used to monitor: depth of anesthesia, as an indirect indicator of cerebral perfusion in carotid endarterectomy to monitor drug effects during the Wada test
Can also be used in intensive care units for brain function monitoring: to monitor for non-convulsive seizures/ status epilepticus, to monitor the effect of sedative/anesthesia in patients in medically induced coma, and can monitor for secondary brain damage in conditions such as subarachnoid hemorrhage.
In patients with epilepsy being considered for surgery, it is often necessary to localize the source of the epileptic brain activity by EEG monitoring rather than by scalp EEG.
The cerebrospinal fluid, skull and scalp distort the electrical potentials recorded by scalp EEG, so neurosurgeons implant strips and grids of electrodes under the dura mater, through either a craniotomy or a burr hole.
The recording of these signals is ref2242ed to as electrocorticography subdural EEG or intracranial EEG
EEG can detect covert processing that does not require a response.
Can be used in subjects who are incapable of making a motor response.
EEG can be used to track brain changes during different phases of brain
development, including evaluating adolescent brain maturation.
Has low spatial resolution on the scalp, and requires problematic interpretation to hypothesize what areas are activated by a particular response.
Determines neural activity that occurs below the cortex poorly.
Cannot identify isolated locations in the brain at which various neurotransmitters can be found.
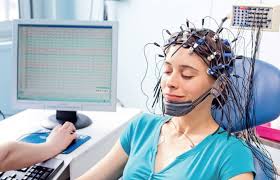
EEG recording is obtained by placing electrodes on the scalp with a conductive gel or paste.
Electrode locations and names are specified by the International 10–20 system ensuring that the naming of electrodes is consistent across laboratories.
In most clinics19 recording electrodes are used, but a smaller number of electrodes are typically used when recording EEG from neonates.
During the recording activation procedures may be used: include hyperventilation, photic stimulation, eye closure, mental activity, sleep and sleep deprivation.
Deep electrodes may also be placed into brain structures, such as the amygdala or hippocampus, structures, which are common epileptic foci.
A typical EEG signal is about 10 µV to 100 µV in amplitude when measured from the scalp.
A typical EEG signal is about 10–20 mV when measured from subdural electrodes.
The EEG is read by a clinical neurophysiologist or neurologist.
EEG has poor spatial resolution and is most sensitive to a particular set of post-synaptic potentials generated in superficial layers of the cortex, on the crests of gyri directly abutting the skull and radial to the skull.
Dendrites, which reside deeper in the cortex: inside sulci, in midline or deep structures such as the cingulate gyrus or hippocampus or those that produce tangential currents to the skull, have poor contribution to the EEG signal.
The EEG signal is obscured by the meninges, cerebrospinal fluid and skull.
Imaging methods of looking at brain activity, such as PET and MRI have time resolution between seconds and minutes, while the EEG measures the brain’s electrical activity directly.
EEG reflects synapse activity caused by post-synaptic potentials of cortical neurons.
Scalp electrical potentials that produce EEG are thought to be caused by the extracellular ionic currents caused by dendritic electrical activity.
The EEG is described in terms of (1) rhythm activity and (2) transients.
Most of the cerebral signal observed in the scalp EEG falls in the range of 1–20 Hz.
Beta wave pattern >13 – 30 Hz, most evident frontally are low-amplitude waves associated with active, busy, anxiety and active concentration.
Beta waves occur during states of relative alertness.
Gamma wave pattern of 30 – 100 HZ,
Delta is the frequency range up to 4 Hz and to be the highest in amplitude and the slowest waves.
Delta waves is seen normally in adults in slow wave sleep.
Delta waves seen normally in babies.
Delta waves may occur focally with subcortical lesions and with diffuse lesions, metabolic encephalopathy hydrocephalus or deep midline lesions.
Delta waves are usually most prominent frontally in adults and posteriorly in children.
Theta waves have a frequency range from 4 Hz to 7 Hz, and is seen normally in young children.
Theta waves may be seen in drowsiness or arousal in older children and adults.
Theta waves may be seen as a result of meditations.
Increased theta waves, for age, represents abnormal activity reflecting focal disturbance in subcortical lesions.
Theta waves can be seen in generalized distribution in diffuse brain disorders, metabolic encephalopathy, deep midline disorders or with hydrocephalus.
Theta waves may be associated with relaxed and meditative states.
Alpha is the frequency range from 8 Hz to 12 Hz., and is the basic posterior brain rhythm originating from the bilateral posterior regions of the head.
Alpha Waves occur during states of relaxed wakefulness.
The alpha wave amplitude is higher on the dominant side.
The alpha wave emerges with closing of the eyes and with relaxation.
The alpha wave attenuates with eye opening or mental exertion.
The sensorimotor rhythm ref2242ed to as the mu rhythm is an alpha rhythm that occurs when the hands and arms are idle.
Diffuse alpha rhythm can be abnormal, as occurs in coma and is not responsive to external stimuli.
Beta wave is the frequency range from 12 Hz to about 30 Hz. and is. seen usually on both sides in symmetrical distribution and is most evident frontally.
Beta activity is linked to motor behavior and is generally attenuated during active movements.
Low amplitude beta activity with multiple and varying frequencies is often associated with active, busy or anxious thinking and active concentration.
Rhythmic beta activity is associated with drug effects, especially benzodiazepines.
Beta activity may be absent or reduced in areas of cortical brain damage.
Beta activity is the dominant rhythm in patients who are alert, anxious or who have their eyes open.
Gamma waves have a frequency range approximately 30–100 Hz, and reflect the binding of different populations of neurons into a network for the purpose of carrying out a certain cognitive or motor functions.
Mu waves range from 8–13 Hz., and partly overlaps with other frequencies.
Mu waves reflect the synchronous firing of motor neurons in the resting state.
Certain activities of the EEG are transient rather than rhythmic.
EEG spikes and sharp waves may represent seizure activity with epilepsy, or be an indicator of its predisposition.
Vertex waves and sleep spindles are patterns seen in normal sleep.
The mu pattern is a normal EEG rhythm.
EEG patterns vary by age with childhood patterns having a slower frequency of oscillations than the adult EEG.
The EEG can be used to define sleep stage by polysomnography.
The EEG may be used to measure the different stages of sleep, including REM and non -REM phases of sleep.
Stage I sleep appears on the EEG as drop-out of the posterior basic rhythm.
Stage 1 is the earliest and lightest stage of sleep, consisting of theta waves when we begin to sleep, but one can be easily awakened by any significant environmental stimulus.
In Stage I sleep there can be an increase in theta frequencies.
Stage II sleep is characterized by sleep spindles, ref2242ing to transient runs of rhythmic activity in the 12–14 Hz range.
Most of the activity in Stage II is in the 3–6 Hz range.
Stage 2 occurs when heart rate and respiration begin to even out, body temperature diminishes, and brave waves Alton a between short bursts or spindles and longer more complex waves.
Stage III and IV sleep are defined by the presence of delta frequencies and are ref2242ed to as slow-wave sleep.
Stages I-IV comprise non-REM sleep.
The EEG in REM (rapid eye movement) sleep appears similar to the awake EEG.
EEG under general anesthesia varies with the type of anesthetic employed: With halogenated anesthetics, such as halothane or intravenous agents, such as propofol, a rapid alpha or low beta nonreactive EEG pattern is seen over most of the scalp.
Electrical signals detected along the scalp that originate from non-cerebral origin are called artifacts, and EEG’s are almost always contaminated by such changes.
Biological artifacts include:eye blinks, eye movements and extra-ocular muscle activity, cardiac artifacts, muscle induced artifacts and gleossokinetic artifacts.
Eye movements, saccades, generate transient electromyographic potentials, known as saccadic spike potentials and confound analysis.
Eye blinking also generates electromyographic potentials, but more importantly there is reflexive movement of the eyeball during blinking that gives a characteristic artifactual appearance of the EEG.
Eyelid fluttering artifacts were previously called Kappa rhythm and usually seen in the prefrontal leads.
Kappa waves are usually in the Theta (4–7 Hz) or Alpha (8–13 Hz) range generated by rapid fluttering of the eyelids, and are are in fact noise in the EEG reading.
The eye movement signals can be used to detect and track eye-movements, important in polysomnography, and in assessing possible changes in alertness, drowsiness or sleep.
EKG artifacts are common and are mistaken for spike activity.
Tongue movements can distort the EEG, especially in parkinsonian and tremor disorders.
Movement by the patient, may cause spikes originating from a momentary change in the impedance of a given electrode.
IV drip devices can cause rhythmic, fast, low-voltage bursts, which may be confused for spikes.
Abnormal activity can broadly be separated into epileptiform and non-epileptiform activity, and into focal or diffuse changes.
Focal epileptiform discharges occur as fast, synchronous potentials in a large number of neurons in a somewhat discrete area of the brain.
These can occur between seizures, and represent an area of cortical irritability that may be predisposed to producing epileptic seizures.
Generalized epileptiform discharges are strongly suggestive of a generalized epilepsy.
Focal non-epileptiform abnormal activity may occur over areas of the brain where there is focal damage of the cortex or white matter.
Focal non-epileptiform activity consists of an increase in slow frequency rhythms and/or a loss of normal higher frequency rhythms.
Focal non-epileptiform activity may also appear as focal or unilateral decrease in amplitude of the EEG signal.
Intracortical electrodes and sub-dural electrodes can be used to discriminate artifact from epileptiform and other severe neurological events.
Continuous EEG monitoring in 1048 intubated patients with spontaneous ventilation found overall 79% of EEG findings were abnormal, with diffuse slowing is the primary abnormality in 67%, focal slowing in 34%, eleptiformorm discharges in 18,5%, and periodic discharges in 3.9% (Betjemann et al).